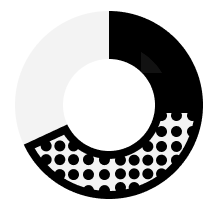
Drawing on an SVG path
Yesterday, i was presented with a bit of a challenge: a donut chart that has three areas in different colors, one of them being a dotted area.

The use case is a visualization of results, i.e. each area represents a certain percentage of the presented data. Nothing special here. The JS library D3 offers various possibilities for displaying donut charts, such as a static donut chart, an animated donut chart, or a donut chart as a tween.
But adding a library for the sake of displaying a few static donuts? Where's the fun in that? Exactly!
Since we already had the SVG implementation for a simpler version, i set out to merely enhance this.
- We call the three parts: the good (plain black area), the bad (plain light gray area) and the indeterminate (the dotted area)
- It does not always show all three areas, could be any of them alone or in pair of two
The resulting SVG
The result misses the border around the dotted area. I don't yet have a good idea other than "add a new layer".
And there is yet one thing i have to understand, and that is the dashoffset. Using the pathLength attribute already gives good control over the numbers of the dasharray. Setting the pathLength to 100, we can easily apply our data percentages. But how does the offset work?
And here's the code.
Cautious with the CSS. It's not scoped to the SVG.
<svg xmlns="http://www.w3.org/2000/svg" viewBox="0 0 48 48" aria-hidden="true" fill="none">
    <style>
        .bad {
            fill: none;
            stroke: lightgray;
            stroke-width: 12px;
        }

        .good {
            fill: none;
            stroke: slateblue;
            stroke-width: 12px;
            stroke-dasharray: 25 75;
        }

        .indeterminate {
            fill: none;
            stroke: salmon;
            stroke-width: 12px;
            stroke-dasharray: 40 60;
            stroke-dashoffset: 40;
        }
    </style>
    <!-- dotted pattern for indeterminate -->
    <!-- see https://css-tricks.com/snippets/svg/svg-patterns/ -->
    <pattern id="pattern-circles" x="0" y="0" width="4" height="4" patternUnits="userSpaceOnUse"
        patternContentUnits="userSpaceOnUse">
        <circle id="pattern-circle" cx="1" cy="1" r="1" fill="#f06d06" />
    </pattern>
    <!-- the bad, lightgray, serves as a base -->
    <circle class="bad" cx="24" cy="24" r="18"></circle>
    <!-- base circle as path, the good -->
    <!-- set pathLength for easy calculation of stroke-dasharray -->
    <!-- path values depend on the size of the base circle -->
    <!-- Values dasharray: 100% = good-percentage + x -->
    <!-- See https://stackoverflow.com/questions/5737975/circle-drawing-with-svgs-arc-path#10477334 -->
    <path class="good" pathLength="100" d="
     M 24, 24
     m 18, 0
     a 18,18 0 1,0 -36,0
     a 18,18 0 1,0  36,0
     " />
    <!-- base circle as path, inapplicable, pathLength for stroke-dasharray -->
    <!-- Values dasharray: 100% = indeterminate-percentage + x -->
    <!-- dashoffset: surprisingly the indeterminate-percentage -->
    <!-- dashoffset: only, if good exists -->
    <path class="indeterminate" pathLength="100" d="
        M 24, 24
        m 18, 0
        a 18,18 0 1,0 -36,0
        a 18,18 0 1,0  36,0
        " />
</svg>